Western Australia Leads in February Wind and Solar Generation
Western Australia has emerged as a frontrunner in renewable energy performance, topping the charts for the best-performing assets in both large-scale solar and wind for the month of February. Despite the hot political debate surrounding the state’s renewable energy progress, recent data from Rystad Energy highlights the significant achievements in Western Australia’s energy sector.
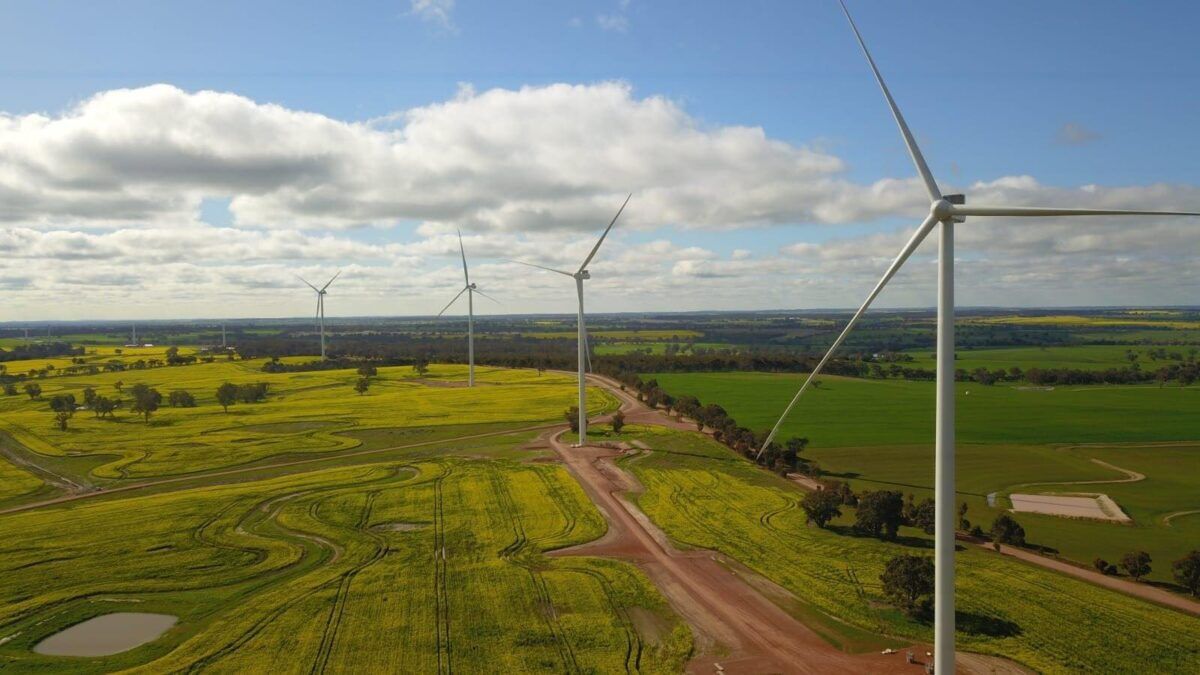
Top Performing Wind Assets
In the realm of wind energy, Western Australia’s main grid showcased remarkable success, with four of the top 10 best-performing wind assets for February located in the state. Potentia Energy’s Flat Rocks wind farm secured the top spot with an impressive capacity factor of 53.7%. Following closely behind was Queensland’s Kennedy Energy Park, with a capacity factor of 49.9%. Western Australia continued its dominance with APA Group’s Badgingarra, Yatch Australia / Alinta Energy’s Yandin wind farm, and Bright Energy Investments’ Warradarge wind farm claiming the third, fourth, and sixth positions, respectively. Tasmania’s Woolnorth wind farm also made the top 10 list, coming in at number seven.
Leading Utility PV Assets
Western Australia also excelled in utility PV assets, with the Greenough River solar farm, co-owned by Potentia Energy and Synergy, securing the top spot with a capacity factor of 39.6%. SUN Energy’s Merredin solar farm followed closely behind in second place. The Glenrowan project in Victoria rounded out the top three solar farms for February, boasting a capacity factor of 38.3%.
Overall, Australian utility PV and wind assets collectively generated 4,519 GWh in February 2025, marking a significant 14% increase from the previous year. New South Wales led the states in energy generation, with a total of 1,324 GWh, primarily sourced from utility PV and wind.
The renewable energy generation share in the National Electricity Market reached 44% in February, a milestone as it surpassed 40% for the first time in that month. Western Australia’s Wholesale Energy Market also saw a notable increase, reaching 42% renewables in February 2025, up from 37% the previous year.
Rystad Energy’s David Dixon highlighted that there were 645 hours of negative prices across the NEM/WEM states in February, with South Australia contributing the most with 222 hours of negative prices, accounting for approximately 33% of the month.
35-768x429.jpg)